TV Script - Trading Dashboard Documentation
Comprehensive documentation for TradingView Pine Script indicators and trading strategies
Swing Dashboard - TradingView Script
A comprehensive TradingView Pine Script indicator combining multiple trading tools into one powerful dashboard for swing traders.
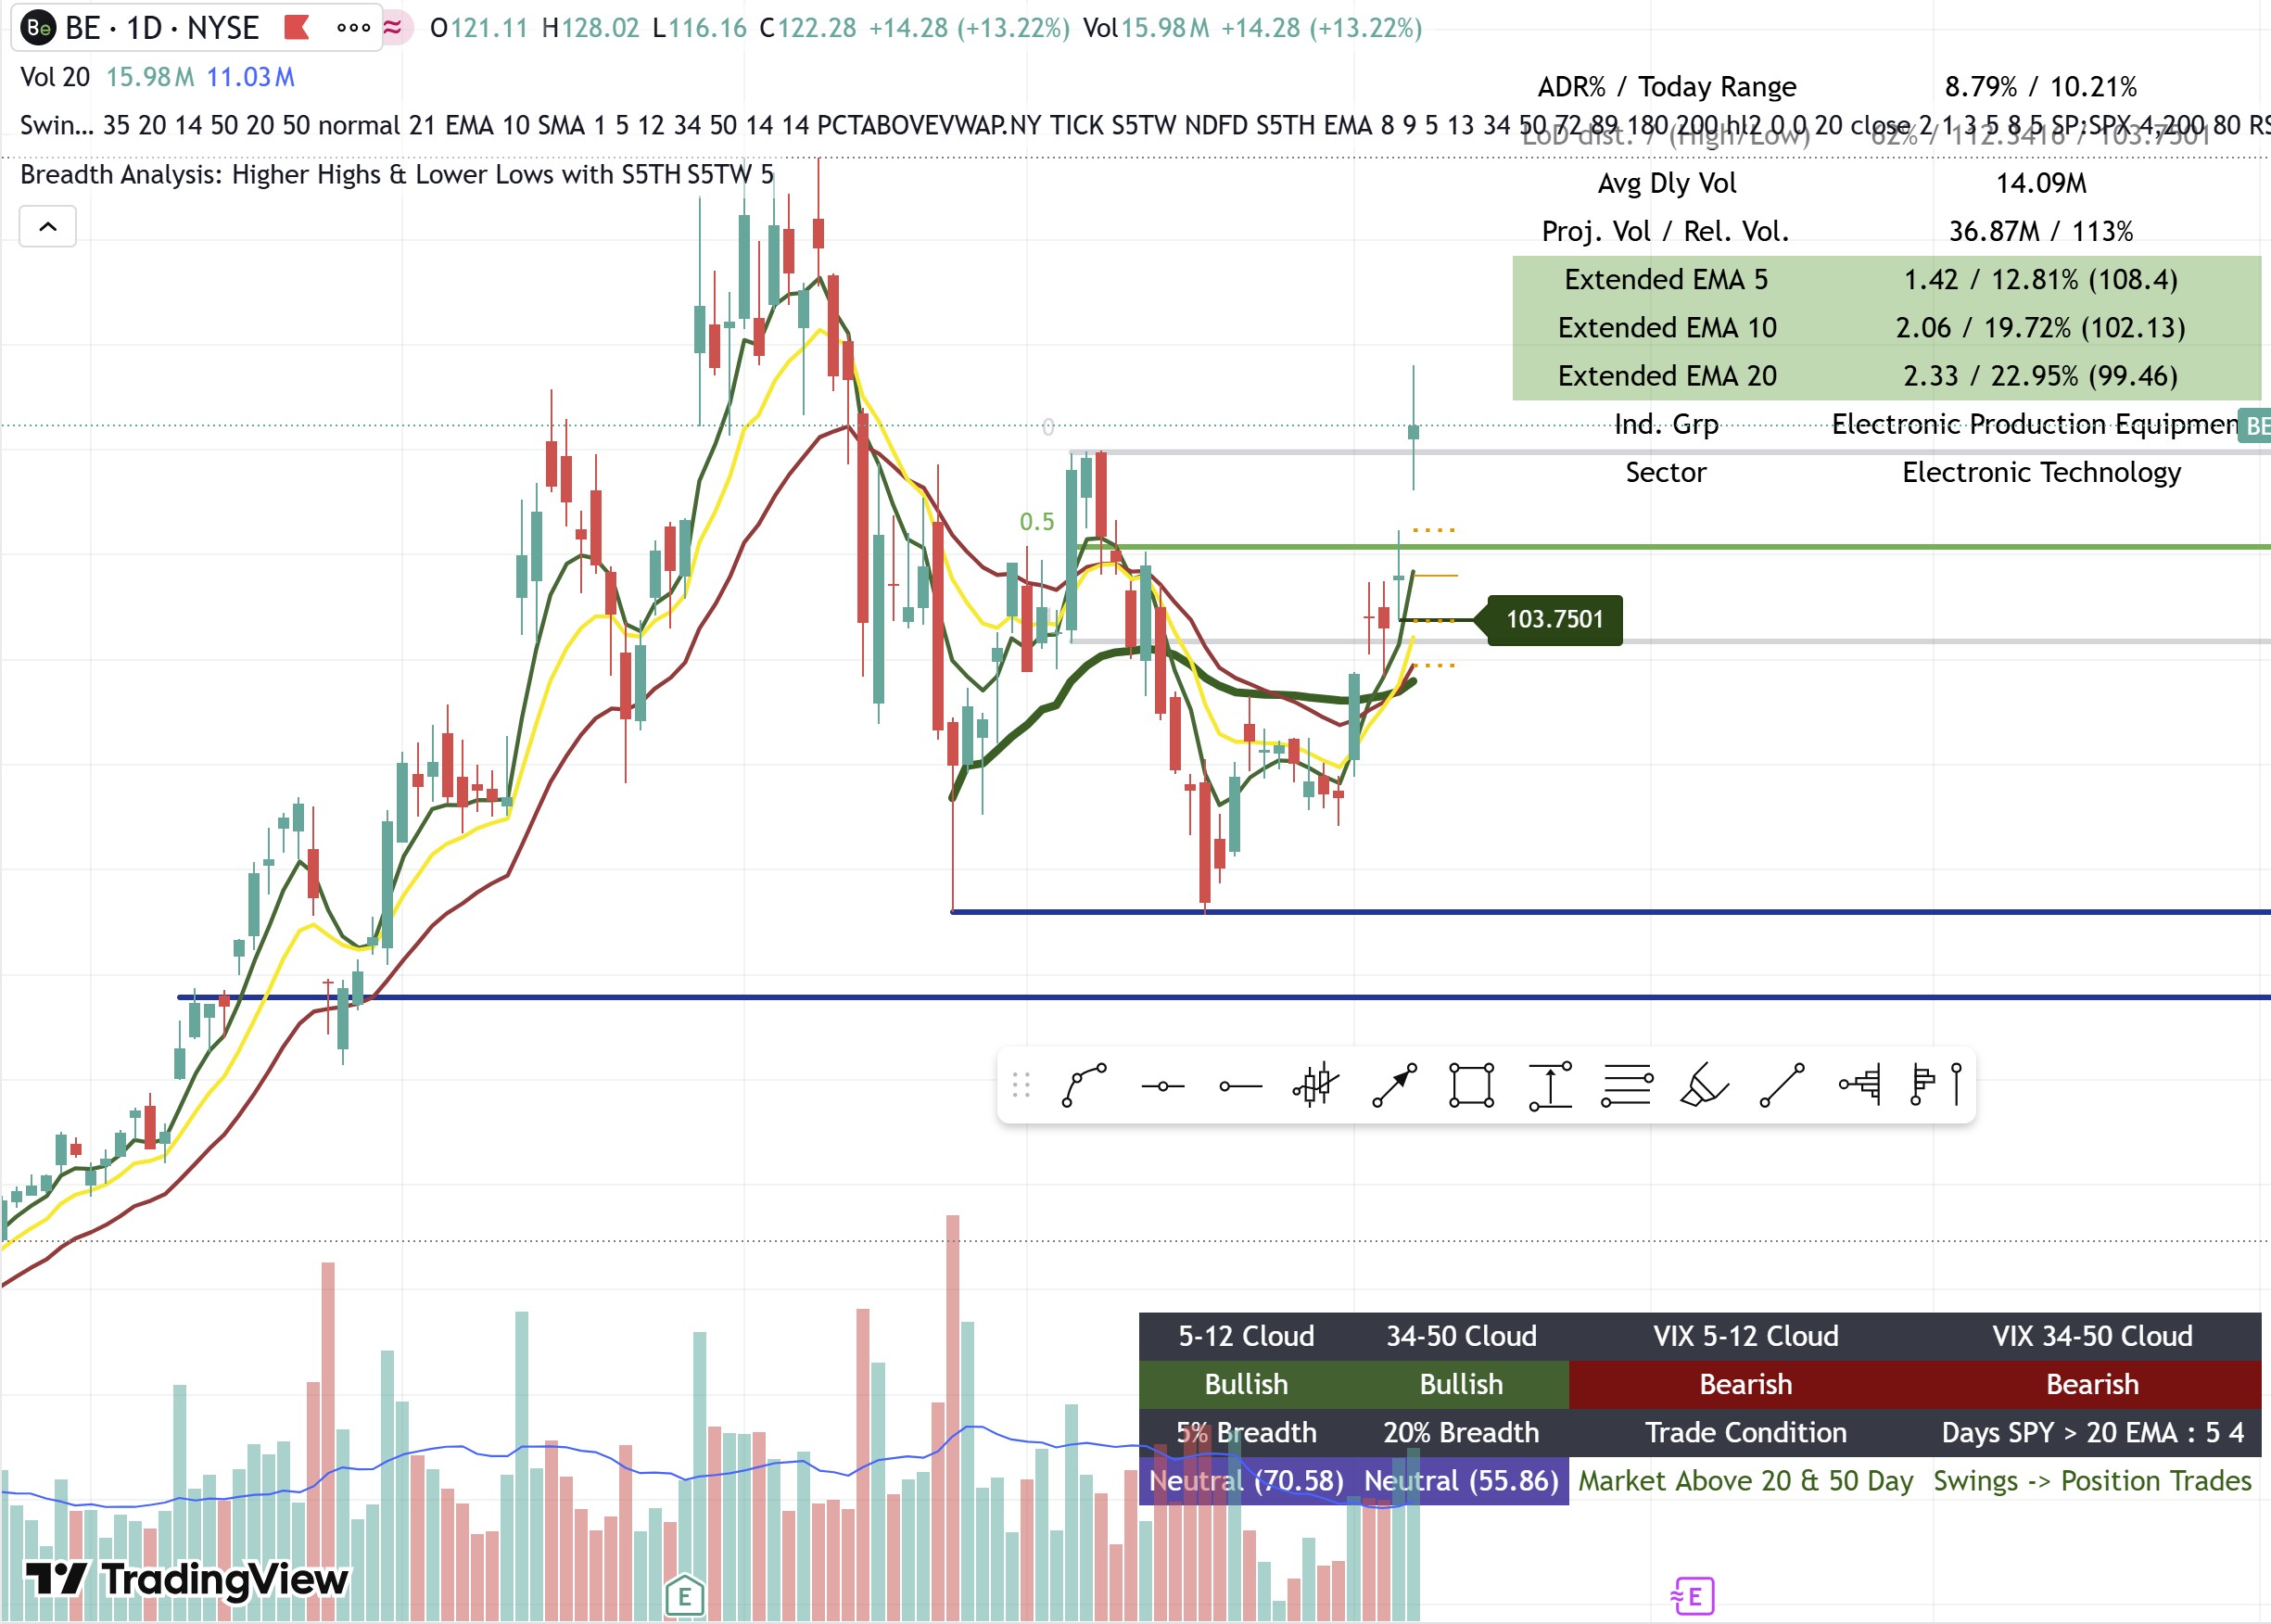
Complete overview of the Swing Dashboard showing all components and features
🚀 Quick Start
- Copy the script from
top-right-table(includes all chart indicators + tables) - Paste into TradingView Pine Editor
- Add to your chart as an overlay indicator
- Customize using the input settings
Note: All chart indicators (21 EMA Structure, RS Rating, Pivot Points, RMV, etc.) come with the
top-right-tablescript. Thebottom-right-tableis a separate standalone script that only includes the EMA Clouds & Market Breadth table.
| Current Version: 2.1 | Pine Script: v6 | Request Calls: 24 (optimized) |
📦 Scripts Overview
top-right-table - Main Script (All Components)
The top-right-table script includes:
- ✅ All chart indicators: 21 EMA Structure, Ripster EMA Clouds, RS Rating, Pivot Points, RMV, Bollinger Bands, Floating Labels
- ✅ Top-right table dashboard: Market data, volume analysis, extended EMAs, sector information
- ✅ Bottom-right table: EMA Clouds & Market Breadth (when enabled)
This is the complete script - copy this one to get everything!
bottom-right-table - Standalone Component
The bottom-right-table script is a separate standalone script that includes:
- ✅ Bottom-right table only: EMA Clouds & Market Breadth indicators
- ❌ No chart indicators: Does not include MA Structure, RS Rating, Pivot Points, etc.
- ❌ No top-right table: Does not include the market data dashboard
Use this only if you want just the EMA Clouds & Market Breadth table without any other features.
📋 What’s Included
The Swing Dashboard is a mashup of multiple trading components. Click any component below for detailed documentation:
Core Components
| Component | Description | Documentation |
|---|---|---|
| 21 EMA Structure | Moving average structure with High/Close/Low MAs | 📖 Learn More |
| Market Data Dashboard | ADR%, ATR, Volume, Extended EMAs, Sector info | 📖 Learn More |
| EMA Clouds & Market Breadth | Stock/VIX clouds, breadth indicators, SPY analysis | 📖 Learn More |
Additional Features
| Feature | Description | Documentation |
|---|---|---|
| Ripster EMA Clouds | 5-layer EMA cloud system for trend analysis | 📖 Learn More |
| RS Rating System | IBD-style relative strength rating (1-99) | 📖 Learn More |
| Pivot Points | Daily pivot levels (R1, Pivot, S1, S2) | 📖 Learn More |
| RMV Indicator | Range Movement Volatility for breakout detection | 📖 Learn More |
| Launch Pad Detection | Consolidation zones before big moves | 📖 Learn More |
| Inside Candle Patterns | Weekly and intraday consolidation patterns | 📖 Learn More |
| Bollinger Bands | Volatility-based support/resistance | 📖 Learn More |
| Extended EMA Analysis | ATR and percentage distance from key MAs | 📖 Learn More |
| Floating Labels | Dynamic right-side labels for key levels | 📖 Learn More |
🎯 Key Features Overview
Market Data Dashboard (Top Right Table)
- ADR% (Average Daily Range) with today’s range
- ATR (Average True Range) measurements
- Volume Analysis: Average, Projected, Relative Volume
- LoD Distance (Low of Day from current price)
- Extended EMA/SMA measurements
- Sector & Industry Group information
- Inside Candle detection (30-min & weekly)
21 EMA Structure (v2.1 - NEW)
- Three MA Lines: High, Close, and Low moving averages
- Timeframe Aware: Auto-adjusts for Daily/Weekly charts
- Trend Colors: Center line changes color based on trend
- Visual Cloud: Gray fill between High and Low MAs
- Bar Coloring: Optional price-based bar colors
- Default Display: Enabled by default
EMA Clouds & Market Breadth (Bottom Right Table)
- Stock EMA Clouds: 5-12 and 34-50 EMAs on 10-min chart
- VIX EMA Clouds: Market sentiment analysis
- Market Breadth: % above 5 SMA, % above 20 SMA
- SPY Analysis: Market condition for trade timeframe selection
⚙️ Configuration
Basic Settings
- Toggle individual dashboard components on/off
- Adjust table sizes and colors
- Configure EMA/SMA lengths
- Set timeframe-specific settings
MA Structure Settings
- Daily MA: Length (default: 21) and Type (EMA/SMA)
- Weekly MA: Length (default: 10) and Type (SMA)
- Colors: Customize High, Close (uptrend/downtrend), Low MA colors
- Toggle: Use custom colors or default gray
- Bar Coloring: Enable/disable price-based bar colors
📊 How to Use
For Swing Trading
- Check Structure: Look for pullbacks to 21 EMA structure
- Verify Volume: Ensure volume confirmation on entries
- Check Breadth: Use market breadth for timing
- SPY Context: Use SPY analysis to determine trade timeframe
- RS Rating: Focus on stocks with RS Rating > 70
For Day Trading
- Pivot Points: Use daily pivots for intraday levels
- LoD: Previous day’s low as support reference
- RMV: Low RMV (< 10) indicates potential breakouts
- Inside Patterns: Watch for inside candle breakouts
🔧 Requirements
- TradingView account with Pine Script v6 support
- Minimum plan supporting 24+ request calls
- Sufficient historical data for calculations
📈 Version History
Version 2.1 (Current)
- ✅ Added MA Structure indicator (High/Close/Low MAs)
- ✅ Customizable colors with toggle option
- ✅ Default display enabled
- ✅ Timeframe-aware settings
Version 2.0
- ✅ Optimized from 47 to 24 request calls
- ✅ Consolidated multiple requests
- ✅ Removed redundant Bollinger Band calculations
- ✅ Maintained all core functionality
🎓 Credits & Acknowledgments
Original Script Credits
- MikeC: First version of the Swing Dashboard
- Fred6724: Contributions and RS Rating system
- TheScrutiniser & GlinckEastwoot: ADR% formula
- Ripster47: Original EMA Clouds + RSI script source
MA Structure Credits
- BalarezoCapital: Original MA Structure concept
- PrimeTrading: Modifications and enhancements
- Alex’s Swing Trading System: PrimeTrading Academy - Inspiration for the 21EMA structure trading methodology
📁 File Structure
tv-script/
├── top-right-table              # Main script (all components)
├── bottom-right-table           # Standalone EMA Clouds component
├── README.md                    # Root README (points to docs)
└── docs/                        # Documentation folder
    ├── _config.yml              # Jekyll config for GitHub Pages
    ├── index.md                 # Main documentation page
    ├── README.md                # Detailed documentation
    ├── README.html              # HTML version of README
    ├── 21ema-structure.md       # 21 EMA Structure guide
    ├── top-right-table-dashboard.md # Market Data Dashboard guide
    ├── bottom-right-table-README.md # EMA Clouds & Breadth guide
    ├── ripster-ema-clouds.md    # Ripster EMA Clouds guide
    ├── rs-rating-system.md      # RS Rating guide
    ├── pivot-points.md          # Pivot Points guide
    ├── rmv-indicator.md         # RMV Indicator guide
    ├── launch-pad-detection.md  # Launch Pad guide
    ├── inside-candle-patterns.md # Inside Candle guide
    ├── bollinger-bands.md       # Bollinger Bands guide
    ├── extended-ema-analysis.md # Extended EMA guide
    ├── floating-labels.md       # Floating Labels guide
    └── TRADING_INSTRUCTIONS.md  # Trading instructions
❓ Troubleshooting
Common Issues
“Too many request calls” error
- ✅ Ensure you’re using Version 2.1 (24 calls)
- ✅ Disable unused components
Compilation errors
- ✅ Check Pine Script v6 syntax
- ✅ Verify all inputs are properly formatted
Missing data
- ✅ Ensure symbol has sufficient historical data
- ✅ Check timeframe settings
Performance Tips
- Disable unused dashboard components
- Use appropriate timeframes
- Consider upgrading TradingView plan if needed
📚 Learn More
- 21 EMA Structure Methodology: PrimeTrading Academy
- TradingView Pine Script: Official Documentation
📄 License
Mozilla Public License 2.0 - See script header for full license terms.
Need help? Check the component-specific documentation pages linked above, or refer to the detailed README.md.