TV Script - Trading Dashboard Documentation
Comprehensive documentation for TradingView Pine Script indicators and trading strategies
Pivot Points System
Overview
The Pivot Points system calculates and displays standard pivot point levels based on the previous day’s high, low, and close prices. These levels act as dynamic support and resistance zones for intraday trading.
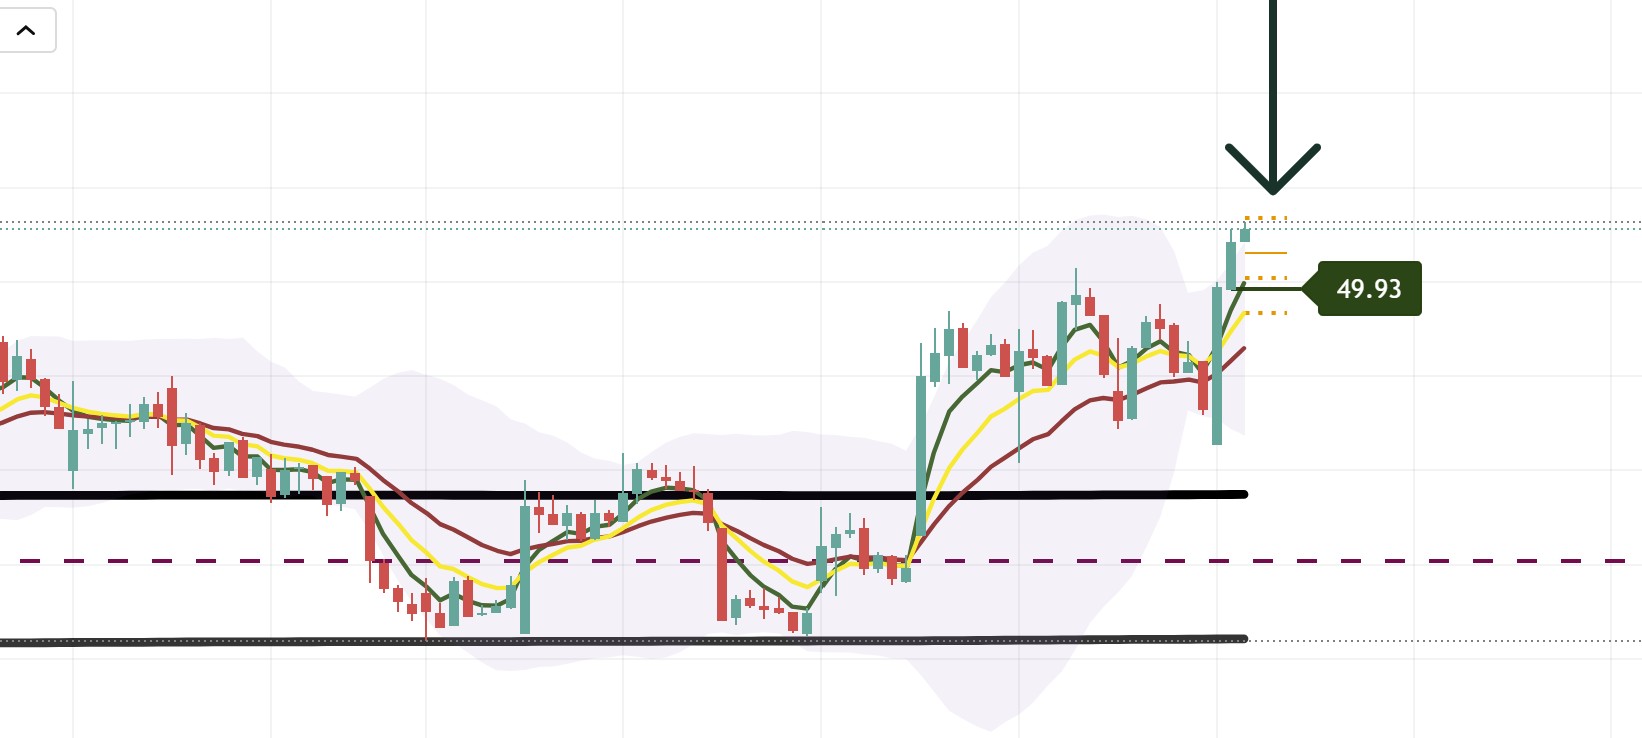
Example of pivot points displayed on an hourly chart showing R1, Pivot, S1, and S2 levels as support/resistance zones
Pivot Levels
Standard Pivot
- Formula:
(High[1] + Low[1] + Close[1]) / 3 - Display: Orange solid line
- Purpose: Primary pivot level - acts as support/resistance
Resistance Levels
R1 (Resistance 1)
- Formula:
2 * Pivot - Low[1] - Display: Orange dotted line
- Purpose: First resistance level above pivot
Support Levels
S1 (Support 1)
- Formula:
2 * Pivot - High[1] - Display: Orange dotted line
- Purpose: First support level below pivot
S2 (Support 2)
- Formula:
Pivot - (High[1] - Low[1]) - Display: Orange dotted line
- Purpose: Second support level below pivot
Visual Display
Lines
- Pivot: Solid orange line (width: 1)
- R1, S1, S2: Dotted orange lines (width: 2)
- Length: Extends 3 bars forward from current bar
Floating Label
- Location: Right side of chart (offset configurable)
- Content: Shows all pivot levels with values
- Format:
R1: X.XXX \Pivot: X.XXX \S1: X.XXX \S2: X.XXX - Color: Orange background, white text
Configuration Options
Display Settings
- Show Pivot Labels: Toggle floating label display
- Line Width: Adjustable (default: 1)
- Remove Floats: Option to hide floating labels
Visual Customization
- Line Style: Dotted for R1/S1/S2, solid for pivot
- Line Color: Orange (customizable in code)
- Label Position: Configurable offset from current bar
Trading Applications
Support/Resistance Levels
- Pivot: Acts as primary support/resistance
- R1: Resistance level for long entries
- S1: Support level for short entries
- S2: Stronger support level
Breakout Trading
- Price Above R1: Bullish breakout signal
- Price Below S1: Bearish breakdown signal
- Price Between Pivot and R1/S1: Range-bound trading
Intraday Trading
- Morning Setup: Use pivot levels for first hour trading
- Range Trading: Trade between S1 and R1
- Breakout Trading: Enter on breaks of R1 or S1
Technical Details
Calculation
// Previous day's data
highPrevDay = high[1]
lowPrevDay = low[1]
closePrevDay = close[1]

// Pivot calculation
pivot = (high[1] + low[1] + close[1]) / 3
r1 = 2 * pivot - low[1]
s1 = 2 * pivot - high[1]
s2 = pivot - (high[1] - low[1])
Line Drawing
- Lines are drawn from current bar extending 3 bars forward
- Uses
line.new()for dynamic line creation - Previous lines are deleted before creating new ones
Best Practices
- Daily Reset: Pivot levels reset each day based on previous day’s data
- Combine with Other Indicators: Use with volume, EMA clouds, or structure
- Watch for Bounces: Price often bounces off pivot levels
- Breakout Confirmation: Wait for volume confirmation on breaks
- Multiple Timeframes: Check pivot levels on different timeframes