TV Script - Trading Dashboard Documentation
Comprehensive documentation for TradingView Pine Script indicators and trading strategies
Bottom Right Table - EMA Clouds & Market Breadth
Overview
The Bottom Right Table provides comprehensive market timing and breadth analysis through EMA cloud indicators, VIX sentiment analysis, and SPY market condition assessment. This component helps traders determine:
- Stock trend direction (via EMA clouds)
- Market sentiment (via VIX clouds)
- Market breadth extremes (via breadth indicators)
- Optimal trade timeframes (via SPY analysis)
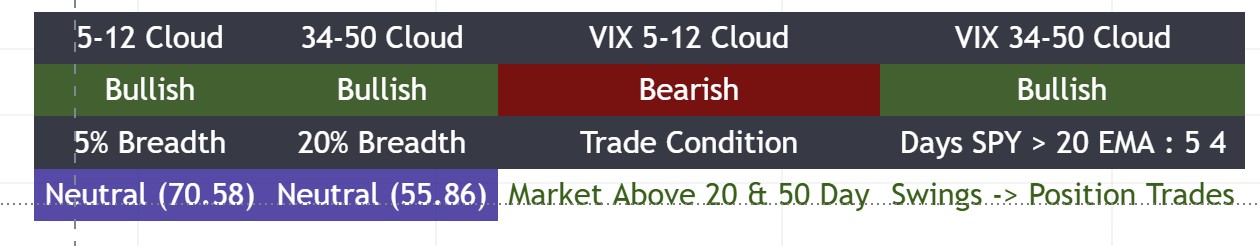
Example of the Bottom Right Table showing EMA clouds, VIX clouds, market breadth indicators, and SPY analysis
Table Layout
Top Section: EMA Clouds (Left) & VIX Clouds (Right)
Stock EMA Clouds (Left Side)
These clouds analyze the stock’s own trend using a 10-minute timeframe:
- 5-12 Cloud: Short-term trend direction
- Bullish: 5 EMA > 12 EMA (green background)
- Bearish: 5 EMA < 12 EMA (red background)
- 34-50 Cloud: Medium-term trend direction
- Bullish: 34 EMA > 50 EMA (green background)
- Bearish: 34 EMA < 50 EMA (red background)
Usage:
- Both clouds bullish = strong uptrend
- Both clouds bearish = strong downtrend
- Mixed signals = choppy/transitional market
VIX EMA Clouds (Right Side)
These clouds analyze market sentiment using VIX on a 10-minute timeframe:
- VIX 5-12 Cloud: Short-term fear/greed indicator
- VIX 34-50 Cloud: Medium-term fear/greed indicator
Usage:
- VIX clouds bullish (VIX rising) = Market fear increasing (contrarian bullish signal)
- VIX clouds bearish (VIX falling) = Market complacency (contrarian bearish signal)
- Use as contrarian indicator for market timing
Bottom Section: Market Breadth & SPY Analysis
Market Breadth Indicators (Bottom Left)
Helps identify market breadth extremes for both short-term and mid-term analysis:
- 5% Breadth: Percentage of stocks above their 5-day SMA
- GO (< 20): Oversold condition - good entry opportunity (green)
- Warning (> 75): Overbought condition - caution (red)
- Neutral: Normal breadth conditions (purple)
- 20% Breadth: Percentage of stocks above their 20-day SMA
- GO (< 30): Oversold condition - good entry opportunity (green)
- Warning (> 75): Overbought condition - caution (red)
- Neutral: Normal breadth conditions (purple)
Usage:
- Extreme Oversold: Both breadth indicators in GO zone = potential market bottom
- Extreme Overbought: Both breadth indicators in Warning zone = potential market top
- Divergences: Stock making new highs while breadth declining = weakening market
SPY Market Condition (Bottom Right)
Helps determine optimal trade timeframe based on SPY’s position relative to key moving averages:
Trade Condition Display:
- Market Above 20 & 50 Day:
- Trade Type: Swings → Position Trades
- Timeframe: Longer holds (5-8+ days)
- Color: Green
- Market Above 50 Day:
- Trade Type: Swing trades
- Timeframe: 5-8 day holds
- Color: Green
- Above 20 Below 50 Day:
- Trade Type: Short Swings
- Timeframe: 1-2 day holds
- Color: Red
- Market Below 50 Day:
- Trade Type: Short Swings
- Timeframe: 1-2 day holds
- Color: Red
Days SPY > 20 EMA:
- Shows consecutive days SPY has closed above its 20 EMA
- Higher count = stronger trend
- Resets to 0 when SPY closes below 20 EMA
Days Since Low < EMA:
- Tracks days since SPY’s low was below its 20 EMA
- Helps identify recent pullback/retest patterns
Technical Details
EMA Cloud Calculations
// Stock EMAs on 10-minute timeframe
[ema5, ema12, ema34, ema50] = request.security(syminfo.tickerid, '10',
    [ta.ema(close, 5), ta.ema(close, 12), ta.ema(close, 34), ta.ema(close, 50)])

// VIX EMAs on 10-minute timeframe
[vix_ema5, vix_ema12, vix_ema34, vix_ema50] = request.security('VIX', '10',
    [ta.ema(close, 5), ta.ema(close, 12), ta.ema(close, 34), ta.ema(close, 50)])
Market Breadth Calculations
// Percentage above 5-day SMA
percent_above_5 = request.security('NDFD', '1D', close)

// Percentage above 20-day SMA
percent_above_20 = request.security('S5TW', '1D', close)
SPY Analysis
// SPY daily close and MAs
spy = request.security('SPY', 'D', close)
ma50 = ta.sma(spy, 50)
ma20 = ta.ema(spy, 20)

// Conditions
above_50_and_20 = spy > ma50 and spy > ma20
above_50 = spy > ma50
above_20 = spy > ma20
below_50 = spy < ma50
Trading Applications
Entry Timing
- Check Stock Clouds: Both 5-12 and 34-50 bullish = favorable trend
- Check VIX Clouds: Rising VIX (bullish clouds) = contrarian bullish signal
- Check Breadth: Oversold breadth (< 20% on 5-day, < 30% on 20-day) = good entry
- Check SPY Condition: Above 20 & 50 = longer holds possible
Position Sizing
- Strong Alignment: All indicators bullish + SPY above both MAs = larger size
- Mixed Signals: Conflicting clouds or SPY below 50 = smaller size
- Extreme Breadth: Oversold breadth = potential for larger moves
Trade Timeframe Selection
- SPY Above 20 & 50: Position trades (5-8+ days)
- SPY Above 50 Only: Swing trades (5-8 days)
- SPY Below 50: Short swings (1-2 days) or cash
Risk Management
- Cloud Reversals: Stock clouds turn bearish = reduce exposure
- Breadth Warnings: Breadth > 75% = overbought, trim positions
- SPY Breakdown: SPY breaks below 50 SMA = defensive mode
Best Practices
- Wait for Alignment: Best setups when stock clouds, breadth, and SPY all align
- Use VIX as Contrarian: Rising VIX (bullish clouds) often precedes market bottoms
- Monitor Breadth Extremes: Oversold breadth + bullish clouds = high probability setup
- Respect SPY Condition: Don’t fight the market - adjust timeframe based on SPY position
- Track Days Above EMA: Longer streaks = stronger trends = larger position sizes
Configuration Options
Display Toggles
- Show Clouds: Enable/disable the entire cloud table
- Show Trend Labels: Show/hide the EMA cloud labels
- Show Market Breadth: Show/hide breadth indicators (requires
show_cloudsenabled)
EMA Lengths
- Length for 5 EMA: Default 5
- Length for 12 EMA: Default 12
- Length for 34 EMA: Default 34
- Length for 50 EMA: Default 50
Visual Settings
- Table Size: Tiny, Small, Normal, or Large
- Background Color: Customizable table background
- Text Color: Customizable text color
Request Call Efficiency
- Total Calls: 2 request calls
- Stock EMAs (4 values consolidated)
- VIX EMAs (4 values consolidated)
- Breadth Data: Uses TradingView custom symbols (NDFD, S5TW)
- SPY Data: Single daily request for SPY analysis