TV Script - Trading Dashboard Documentation
Comprehensive documentation for TradingView Pine Script indicators and trading strategies
Top Right Table - Market Data Dashboard
Overview
The Top Right Table is the primary data dashboard displayed in the top-right corner of your TradingView chart. It provides comprehensive market data, volume analysis, extended EMA/SMA measurements, and fundamental information to help swing traders make informed decisions.
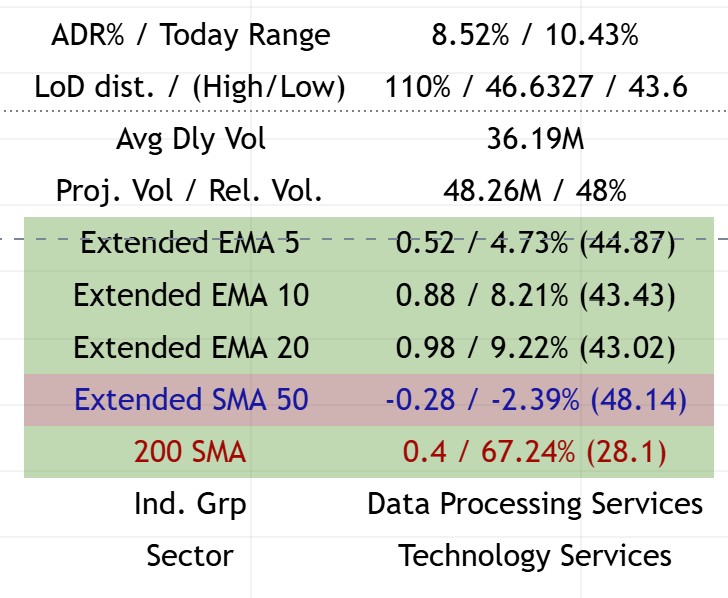
Example of the Top Right Table showing market data, volume analysis, extended EMAs, and sector information
Components
Market Data Metrics
ADR% / Today Range
- ADR%: Average Daily Range percentage over the specified period (default: 20 days)
- Today Range: Current day’s range as a percentage
- Purpose: Helps identify volatility and expected daily movement
- Usage: Higher ADR% indicates more volatile stocks, useful for position sizing
LoD Distance / (High/Low)
- LoD Distance: Low of Day distance from current price, measured in ATR multiples
- Yesterday High: Previous day’s high price
- Yesterday Low: Previous day’s low price
- Purpose: Shows how far price is from the day’s low and previous day’s range
- Usage: Helps identify intraday support levels and potential reversal zones
Average Daily Volume
- Avg Dly Vol: Average daily volume over the specified period (default: 50 days)
- Formatted: Automatically converts to K (thousands), M (millions), or B (billions)
- Purpose: Identifies liquidity and institutional interest
- Usage: Higher volume = better liquidity and cleaner price action
Projected Volume / Relative Volume
- Projected Volume: Estimated end-of-day volume based on current pace
- Relative Volume: Current volume vs. average volume (percentage)
- Purpose: Identifies unusual volume activity
- Usage:
- Relative Volume > 100% = Above average volume (institutional interest)
- Relative Volume < 100% = Below average volume (low interest)
Extended EMA/SMA Analysis
The Extended section shows how far price has extended from key moving averages, measured in:
- ATR Multiples: How many ATRs away from the MA
- Percentage: Percentage distance from the MA
- MA Value: Current value of the moving average
Extended EMA 5
- Color Coding: Green background when positive, red when negative
- Shows: Distance from 5-period EMA
- Usage: Short-term momentum indicator
Extended EMA 10
- Color Coding: Green background when positive, red when negative
- Shows: Distance from 10-period EMA
- Usage: Short-term trend extension
Extended EMA 20
- Color Coding: Green background when positive, red when negative
- Shows: Distance from 20-period EMA
- Usage: Medium-term trend extension
- Note: Can show “Pre” label when approaching earnings
Extended SMA 50
- Color: Blue text
- Shows: Distance from 50-period SMA
- Usage: Medium-term trend analysis
- Display: Only shows when
show_longer_mais enabled or when extension < 0.1
200 SMA
- Color: Red text
- Shows: Distance from 200-period SMA
- Usage: Long-term trend analysis
- Display: Only shows when
show_longer_mais enabled or when extension < 0.1
Additional Information
Sector & Industry Group
- Sector: Company’s sector classification
- Ind. Grp: Industry group classification
- Purpose: Helps identify sector rotation and relative strength
- Usage: Compare sector performance to individual stock performance
Inside Week / Inside Candle Detection
- Inside Week: Detects when previous week was an inside week (high < prior high, low > prior low)
- Inside Candle: Detects inside candle patterns on specified timeframe (default: 30-min)
- Purpose: Identifies consolidation patterns that often precede breakouts
- Color Coding: Purple background when detected
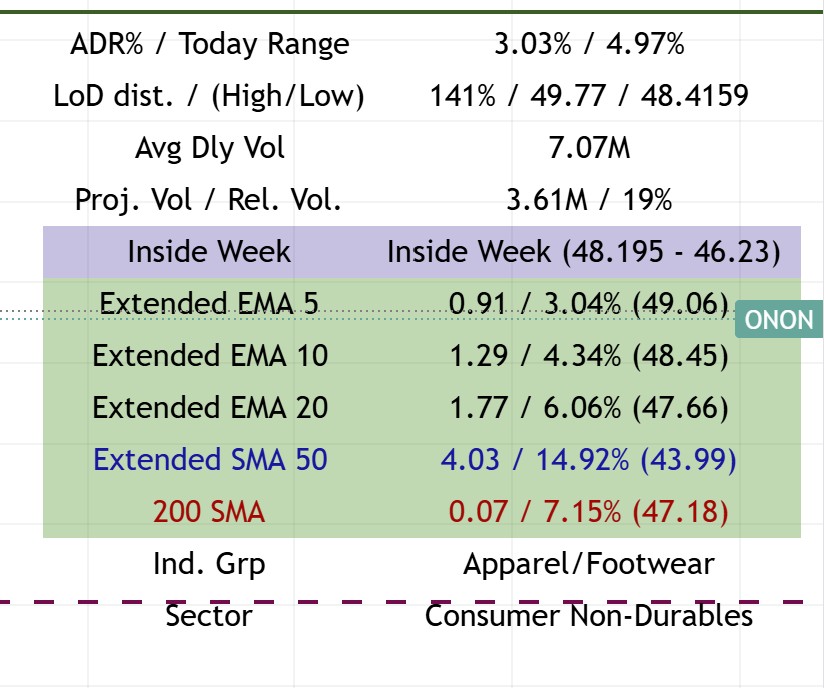
Example showing the Top Right Table with Inside Week pattern detected (purple background highlight)
Configuration Options
Display Toggles
- Show Market Cap: Toggle market capitalization display
- Show Float %: Toggle float percentage display
- Show ADR%: Toggle ADR% and today’s range
- Show ATR: Toggle ATR display
- Show LoD dist.: Toggle Low of Day distance
- Show Avg Daily $ Volume: Toggle dollar volume display
- Show Avg Daily Volume: Toggle volume display
- Show Projected Volumes: Toggle projected volume
- Show Relative Volume: Toggle relative volume
- Show Extended: Toggle extended EMA/SMA section
- Show Sector: Toggle sector display
- Show Ind. Grp: Toggle industry group display
Extended EMA/SMA Settings
- Extended EMA Input: Which EMA to show extension from (default: 20)
- Extended SMA Input: Which SMA to show extension from (default: 50)
- Show Longer MAs: Enable display of 50 SMA and 200 SMA
Visual Settings
- Table Size: Tiny, Small, Normal, or Large
- Background Color: Customizable table background
- Text Color: Customizable text color
- Show Empty Row: Add spacing above table to avoid overlap with pane icons
Trading Applications
Position Sizing
- ADR%: Use to determine position size based on volatility
- Extended Distance: Avoid buying when >1x ATR above 21dma structure
- Volume: Higher relative volume = stronger conviction
Entry Timing
- LoD Distance: Shows if price is near daily low (potential support)
- Extended EMAs: Shows if price is extended (wait for pullback)
- Inside Patterns: Consolidation often precedes breakouts
Risk Management
- ATR: Use for stop-loss placement
- Extended Distance: Larger extension = higher risk
- Volume: Low volume = less conviction = smaller position
Technical Details
Volume Calculations
// Relative Volume
relVol = vol / ta.sma(vol, len) * 100

// Projected Volume
volume_per_second = volume / time_passed
volume_projected = volume + volume_per_second * time_left
Extended Calculations
// Extended in ATR multiples
extended_ema = (close - price_ema) / atr

// Extended in percentage
percent_change_from_ema = (close - price_ema) / price_ema * 100
Inside Candle Detection
// Inside Week
isInsideWeekCandle = (prior_week_high < twoPriorWeekHigh and
                      prior_week_low > twoPriorWeekLow)

// Inside Candle (configurable timeframe)
isInsideCandle = (twoPriorthirtyMinHigh >= prevThirtyMinHigh and
                  twoPriorthirtyMinLow <= prevThirtyMinLow)
Best Practices
- Monitor Relative Volume: Look for stocks with Rel. Vol > 100% for institutional interest
- Check Extension: Avoid entries when Extended EMA 20 > 1.0 ATR
- Watch Inside Patterns: Inside weeks/candles often precede significant moves
- Use LoD Distance: Helps identify intraday support levels
- Sector Context: Compare stock performance to sector performance